I. Tianjin Shipping Index (TSI)
In Week 1, 2025 (Jan.2 to Jan.3), according to the index release schedule, Tianjin Shipping Index (TSI) was released twice. The TSI rebounded continuously, closing at 1255.04 points, with a cumulative increase of 15.94 points or 1.29% from Dec.24, 2024 (the last release day of Week 52). The trend of TSI is as follows:
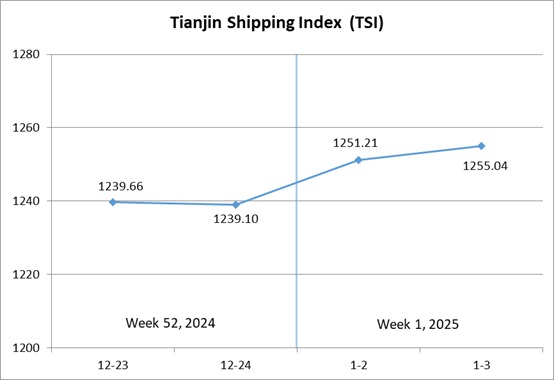
The value and trend of TSI is as follows:

II. Tianjin Container Freight Index (TCI)
In Week 1, 2025 (Dec.30,2024 to Jan.3,2025), Tianjin Container Freight Index (TCI) was released four times, and the trend of it is as follows:
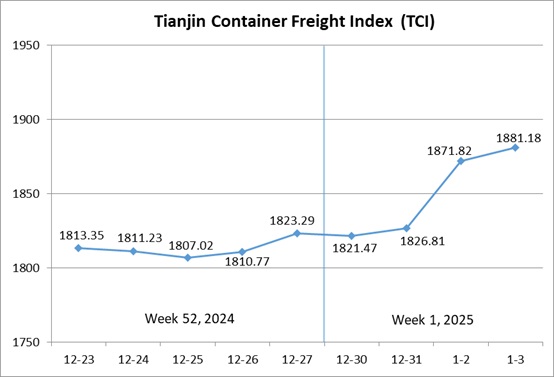
In Week 1, the TCI climbed rapidly.
From Dec.30-Dec.31, 2024 (Mon.-Tue.), the freight rates in European route, Mediterranean East route, American route and South American route increased, and the freight rates in Mediterranean West route and Indian route decreased slightly. The TCI increased slightly, with a cumulative increase of 0.19% in the two release days. After New Year’s Day, the freight rates in European route and Mediterranean route decreased slightly, and the freight rates in American route, Central and South American route and Indian route showed strong performance. The freight rates in South American West route and South American East route increased at first and then decreased. The TCI increased rapidly, with a cumulative increase of 2.98% from Jan.2-Jan.3 (Thur.-Fri.).
Finally, the TCI closed at 1881.18 points, with a cumulative increase of 57.89 points (3.18%) from Dec.27 (the last release day of Week 52,2024).
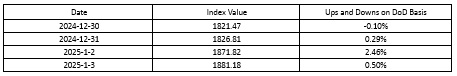
The TCI index value and several ups and downs on a day-on-day basis are as follows:
The TCI includes 19 sample routes. The main route analysis of this week is as follows:
European/Mediterranean route Freight rates experienced mixed movements. For European route and Mediterranean East route, there were differing market expectations. Some shipping companies attempted to raise freight rates at the beginning of the week, but there was no significant change in cargo volumes, leading to a decline in freight rates later in the week. The freight index in European route closed at 1458.27 points, with the decrease of 0.85% on a week-on-week basis. The freight rate in Mediterranean East route increased strongly. The freight index closed at 1675.49 points, with the increase of 0.53% on a week-on-week basis. In contrast, for Mediterranean West route, , the market lacked cargo volume support, coupled with the continued easing of congestion at major ports such as Valencia. The freight rate continued to decrease this week. The freight index closed at 2129.49 points, with the decrease of 2.45% on a week-on-week basis.
American route On the American East Coast route, there was an increasing possibility of port strikes, and shipping companies were imposing port congestion surcharges, leading to a significant surge in freight rates. The freight index closed at 1623.48 points, with the increase of 8.12% on a week-on-week basis. On the American West Coast route, some shipping companies were redirecting cargo to American West Coast ports, which was expected to tighten capacity on this route and had also driven a rapid increase in the freight rate this week. The freight index closed at 1813.48 points, with the increase of 16.56% on a week-on-week basis.
South American route As the Spring Festival holiday approached, factories started to increase their concentrated shipments. Coupled with the impact of seawater inflow from Peru that led to the closure of major ports such as Callao, as well as shipping companies increasing Panama Canal transit surcharges, overall freight rates on shipping routes had been relatively strong this week. The freight indices in South American West route, South American East route and Central and South American route closed at 1230.27 points, 2779.30 points and 1486.68 points, with the increase of 9.22%, 2.41% and 11.54% on a week-on-week basis.
Indian route During the traditional peak shipping season before the Spring Festival, after some shipping companies raised freight rates last week, other shipping companies followed suit and increased freight rates this week. The freight index closed at 1360.19 points, with the increase of 3.86% on a week-on-week basis.
III. Tianjin Bulk Freight Index (TBI)
In week 1, 2025 (Jan.2 to Jan.3), the trend of Tianjin Bulk Freight Index (TBI) is as follows:
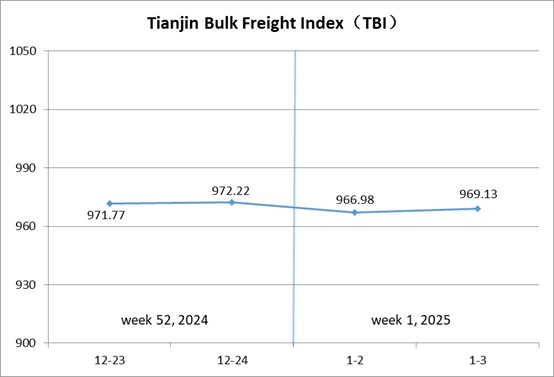
In week 1, the TBI kept stable as a whole.
On January 2 (Thur.), the freight rate of coal decreased significantly and the freight rates of grain and metal increased slightly,which drove the TBI to decrease 0.54% on a day-on-day basis. On January 3 (Fri.), the decline of coal freight narrowed and the freight rates of grain and metal continued to increase. Compared with December 24 (the last releasing day of Week 52, 2024), the TBI rebounded slightly and finally closed at 969.13 points with a cumulative decrease of 3.09 points (0.32%).
TBI index value saw several ups and downs on a day-on-day basis, which is shown as follows:

TBCI Closed at 740.28 points with a cumulative decline of 24.70 points (3.23%) compared to December 24 (the last releasing day of the Week 52, 2024). The freight rate of Indonesia to Qingdao route decreased with a decline of 3.76% on a week-on-week basis. The freight rate of Hay Point to Qingdao route decreased with a decline of 2.86% on a week-on-week basis.
TBGI Closed at 874.01 points with a cumulative increase of 3.03 points (0.35%) compared to December 24 (the last release day of Week 52, 2024). The freight rate of South America to Tianjin route increased 0.35% on a week-on-week basis, the freight rate of U.S. Gulf to Tianjin route increased 0.39% and the freight rate of West America to Tianjin route increased 0.14% on a week-on-week basis.
TBMI Closed at 1293.11 points with a cumulative increase of 12.40 points (0.97%) compared to December 24 (the last releasing day of Week 52, 2024). The freight rate on route from West Australia to northern China increased 1.00% on a week-on-week basis. The freight rate of Brazil to Tianjin route increased 2.03% on a week-on-week basis. The freight rate on route from Surigao to Tianjin decreased 1.06% on a week-on-week basis.
IV. Tianjin Domestic Container Freight Index (TDI)
In Week 1 (December 30, 2024 - January 3, 2025), Tianjin Domestic Container Freight Index (TDI) was released 4 times, and the trend is shown in the chart below:
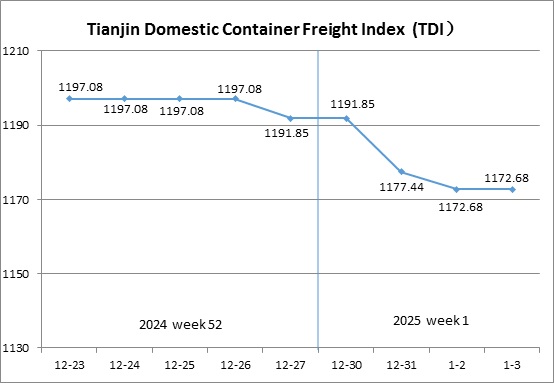
In week 1, the Tianjin Domestic Container Freight Index significantly decreased.
On Monday, December 30, 2024, the inbound and outbound indices remained stable. On Tuesday, the outbound index significantly decreased, dragging down TDI. On Thursday, January 2, 2025, the inbound index slightly declined, and TDI further declined. On Friday, the inbound and outbound indices returned to stability. TDI ultimately closed at 1172.68 points, a cumulative decrease of 19.17 points or 1.61% compared to December 27, 2024 (the last release day of the 52nd week).
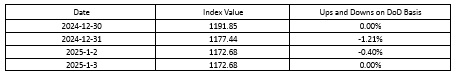
The TDI index value and several ups and downs on a day-on-day basis are as follows:
The Tianjin Domestic Container Outward Freight Index (TDOI) Continued its downward trend, closing at 1238.61 points on January 3, 2025, a cumulative decrease of 28.83 points or 2.27% compared to December 27, 2024 (the last release day of the 52nd week of 2024). The freight rates in the Tianjin domestic trade outbound container market have further declined, and shipping companies plan to reduce voyages around mid-month. Shippers are accelerating their shipments, and freight rates to East China remain stable. The freight rate index for the Tianjin to Shanghai route closed at 1141.37 points, unchanged from the previous week. The freight rates to Fujian and South China continue to decline, with the Tianjin to Quanzhou/Xiamen and Tianjin to Guangzhou routes closing at 1288.71 and 1238.95 points respectively, a decrease of 4.26% and 2.08% on a weekly basis.
The Tianjin Domestic Container Inward Freight Index (TDII) Saw a slight decline, closing at 1106.75 points on January 3, 2025, a cumulative decrease of 9.51 points or 0.85% compared to December 27, 2024 (the last release day of the 52nd week of 2024). After New Year's Day, the freight rates for Tianjin's inbound container transportation have fluctuated. The freight rates in East China have significantly decreased, with the Shanghai to Tianjin route freight rate index closing at 1061.42 points, a week on week decline of 11.97%; Fujian's freight rates continue to be low, with the market freight rates for the Quanzhou/Xiamen to Tianjin route rising by 3.48% this week, closing at 812.71 points. South China freight rates remained stable, with the Guangzhou to Tianjin route closing at 1186.56 points, unchanged from the previous week.
(The analysis report is for reference only and at your own risk)